The purpose of this research was to investigate failed cement paste specimens and determine the crack growth rate (CGR). The CGR (normally used for metals) would be calculated by a combination of material parameters and microscopic analysis to ultimately find the strength of the failed specimen. It was found that by using the CGR, the strength of the cast and failed specimens could not be predicted.
Cement Paste Design, Casting, and Curing
Two grout mixes were designed, batched, and tested for the project. A Type I/II Portland Cement was used in combination with an ASTM C 33 concrete sand. One mix contained a colloidal silica dispersion with a particle size distribution between 3 to 100 nanometers (Mix ID 9011), while the second mix contained Portland cement without colloidal silica (Mix ID 9016). Both mixes included a high-range water reducer at 4.0 fluid oz. per cement hundred weight and a water-to-cement ration of 0.35.
Failure Stress Determination
Both sample sets were cured according to ASTM C protocol in a temperature-controlled lime-water bath for 28-day before breaking.
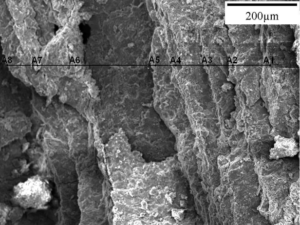
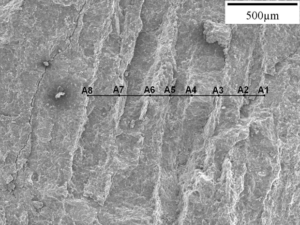
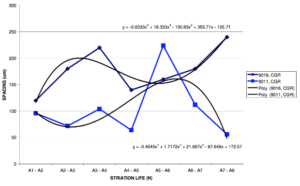
By magnifying the failed specimens and identifying the striation distances, a CGR (da/dN) could be determined. Refer to Figure 1 and Figure 2 for illustrations of the striation separations. The points between the striations were used to determine a trend fit using a 4th order polynomial equation. This derivative of this equation was taken to determine the CGR. Refer to Figure 3 for the trend equations for the various mixes.

Figure 1 —SEM Image of Striations After Compressive Strength Failure, No Colloidal Silica

Figure 2— SEM Image of Striations After Compressive Strength Failure, With Colloidal Silica

Figure 3 — Crack Growth Rate
Using the Paris Equation (Eqn. 1) the stress at which the specimen failed could be calculated and compared to the actual failure stress. From the analysis conducted by Ciavarella et al., the properties for C and m were determined(8). The value for KIC was determined from experimental testing conducted by Shah(9).
EQUATION 1 — — — da /dN = C∆K^m
From the retrieved data and the given equations, it was found that both samples were calculated to be approximately 6600 PSI.
Mix ID 9011 and 9016 broke with an average compressive strength of 11980 psi and 12570 psi, respectively.
While the project was a failure it was interesting to identify the striations in the failed specimens and research the possibility that fatigue analysis could be extended to cement composites.

Hello Researchers
First, I would like to thank you for sharing your research activities/outcomes time to time. I found them really interesting and gain useful information.
Today I am writing you as you provided an opportunity to comment on the website directly.
I like this study because of a simple yet unique idea of measuring the crack growth. Certainly, the colloidal silica admixed specimens outperformed the control specimens as evident from its dense, compact and uniform matrix, however, it would be interesting to support the results from mineralogy or bond characteristics from XRD and FTIR analysis, respectively. I would like to know if the SEM analysis was carried out on paste specimens or the fragmented mortar specimens after the compression testing? Because sand is an inert material, I believe that the microstructure of paste specimens should be compared.
Best regards
Muhammad Nasir, PhD
Lecturer, Civil and Construction Engineering Department
Imam Abdulrahman Bin Faisal University, Saudi Arab
Excellent article. I certainly love this website. Keep writing!