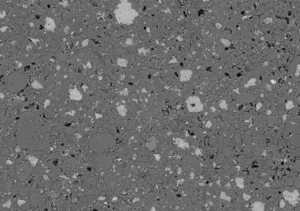
An image of the hydrated cement microstructure was taken with a back-scattered electron microscope. The microstructure is simulated in the software discussed.
Introduction
The research conducted explored the use of computer models and simulations to accurately predict the development of strength in concrete over time. The purpose of this research was to offer evidence that modeling and simulation techniques could be used in the commercial concrete industry as a time and cost-effective tool in concrete design and analysis.
Modeling and simulation of concrete can be used on a wide variety of concrete types analyzing changes based on material shape, chemical composition, content as well as curing environment.
In the research conducted, the role of excess water in the strength development of concrete is used to illustrate concrete modeling and simulation software as a design and analysis tool. The models and simulations evaluated the mechanical properties and kinetics of cement hydration of three different concrete mixtures with the following water-to-cementitious ratios: 0.30, 0.45, and 0.60. The properties identified from the models and simulations were compared to laboratory specimens made up of a Type I/II Ordinary Portland Cement and a washed alluvial aggregate.
The modeling and simulation, verified by laboratory data, accurately predicted the dependency of compressive strengths on a densified microstructure. The simulations and thermal gravimetric analysis correlated with a reduction of calcium hydroxide and acceleration in heat of hydration curves for the lower water-to-cementitious ratio mixes. Both the simulation and laboratory data indicated densification of cement matrix microstructure for the lower water-to-cementitious ratio mixes and accurately predicted an increase in strength of the concrete composite over time.
 An example of the simulated cementitious microstructure from VCCTL.
Definitions
Concrete is one of the most popular construction materials used throughout the construction industry. Concrete formulation and experiments are needed to determine fresh and hardened properties need to place the material as well as ensure its engineering properties are adequate to support structural loads. Concrete experiments in the laboratory and field require excessive amounts of time, money, labor, and materials. New means and methods for understanding specific mix design are needed.
Purpose
The purpose of this research was to illustrate a new approach in concrete design and analysis, modeling, and simulation, which can establish an approximate understanding of materials and how they combine to form concrete [1]. This time and material saving technique can be used on a wide variety of concrete types analyzing changes based on material type, shape, chemical composition, as well as curing environment. A specific software package (Virtual Cement and Concrete Testing Laboratory, VCCTL) was employed throughout this research endeavor as an example of modeling and simulation in the concrete formulation [10–13]. Laboratory mixes were batched and cast to compare the laboratory samples to the VCCTL model [10–13].
Modeling and Simulation Defined
The definition of a model in this research endeavor is assumed to be the following: a mathematical expression mathematical expression key principles or rules to represent a physical phenomenon [1,6,7]. A model is a set of mathematical expressions, which describe a physical phenomenon or event. When more complex models are used, fewer assumptions are normally made and the math becomes.
The most popular concrete model known and used has to be Duff Abram’s w/c law, Equation 1, which was developed in 1919 [2,3]. Though the model is adequate for design and engineering analysis, it requires a lot of assumptions to be made to include — assuming concrete strength is based totally on the hydrating cementitious environment.
What is a Concrete Model?
In order to distinguish a higher resolution (or more results) from concrete models and simulations, more information is needed about our hydrating materials with respect to (1) growth over time, (2) term kinetics of hydrating cement particles, and (3) strength of finished products [1,6,7,10]. By analyzing the modeled concrete, an approximate understanding of concrete strength development can facilitate another method to understanding this complex process. Equation (1) illustrates the inverse relationship between the w/c ratio and concrete compressive strength (f’c)[2,3].
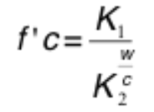
Equation 1 – Duff Abram’s w/c law.
Where K1 and K2 are empirical constants summarizing the effects of cement type, aggregate, curing, testing conditions, and concrete age at the time of test, w/c is the mass of water over the mass of cement, and f’c is the compressive strength of the cured concrete in MPa.
Given this inverse relation, it would mean that Abram’s law delivers the highest compressive strength value when the w/c is the lowest value. The goal of the project was to analyze the impact of different w/c ratios on the mechanical strength of concrete and to compare the modeling results developed here with associated experimental data.
Ultimately, concrete models employ mathematical equations that can represent the growth and strength development of our hydrating concrete mixture. From the development of the microstructure to the determination of hydrated and mechanical properties a wide variety of models are taken advantage of in order to represent the concrete composite. These models have been established based on empirical data — the closer we can get to measuring the kinetics of hydration, the more accurate our models and simulations are.
What is a simulation?
A simulation is the collection of mathematical models in several routines to express a physical event. When these equations are expressed in the form of changing over time, the mathematical models can be used to predict the change in the properties of our materials over time. Analyzing this takes a considerable amount of numerical analysis. In lieu of running these analyses by hand — computer software was developed to collect these models and use them to analyze the change in simulated properties.
Advantages of Concrete Video Games
The advantages for the application of modeling and simulation in the concrete industry are (1) saving time and money, (2) approximate understanding of concrete properties due to material changes, and (3) design and analysis of new concrete mixtures. With VCCTL, you can create and simulate the hydration of virtual specimens of cement paste, mortar, or concrete.
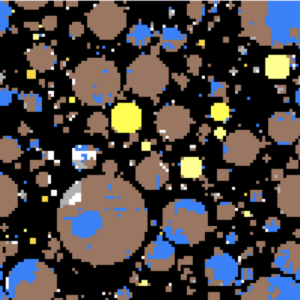
Figure 1 — An example of the simulated cementitious microstructure from VCCTL.
How Does it Work?
Microstructure Development
In creating the final concrete composite and its hydrating properties, it is first necessary to develop a picture of the unhydrated concrete composition. VCCTL randomly places cement particles in a digital box in-order to develop an anhydrous microstructure, Figure 1, which can be used to initiate the dissolution and chemical reaction of the cementitious components to develop the hydrated microstructure [12]. This anhydrous microstructure will have characteristics based on the 2D image and user input a lot of factors such as distribution, surface area, phase volume.
A three-dimensional (3D) image is developed based on user-defined concrete constituents and algorithms designated for constituent distribution. The 3D digital space is made up of voxels designated to the chemical composition and particle size distribution of the material. The randomly oriented cement particles are then designated as silicate or aluminates and then finally as tri-calcium silicates or di-calcium silicates [13]. The end result is a cement microstructure developed in a digital space by a multitude of algorithms.
Phase Development
Growth of the cementitious microstructure is initiated and progressed in the environmental conditions defined by the user. The growth of reactive voxels propagates based on predefined models for dissolution, diffusion, and reaction. An initial scan is made through all elements present in the 3D microstructure to identify voxels in contact with pore water.
A voxel is determined if it is eligible for dissolution and assigned solubility parameters, which dictate: specific dissolution stage and solubility probability. If both parameters allow dissolution, the particle (collection of voxels) is converted into a collection of ions [12,13]. Diffusion and reaction of the cementitious media are allowed in available pore space. Particle interaction and boundaries are regulated by rules that govern voxel interaction, in Appendix A of this series.
As hydration in the confined digital space progresses the growth of the cementitious phases change. The connectivity between the particles is defined through percolation theory; the connection between the pores within the hydrated cement matrix [8]. The details ascertained from the VCCTL that are connected with percolation include degree of hydration, connectivity of phases, and capillary porosity.
The hydrated structure is simulated through finite element procedures combined with knowledge of individual phase moduli to quantitatively predict elastic moduli as a function of the degree of hydration. The composite can also include the impact of the inert voxels (aggregate, fillers) on the material modeled.
Elastic Properties
The elastic properties are determined by a differential effective medium theory (D-EMT) by Sun et al which assigns elastic moduli to corresponding bulk paste matrix, interfacial zone (ITZ) between matrix-aggregate and aggregate [13]. In the D-EMT technique, each aggregate particle, surrounded by a shell of ITZ of uniform thickness and properties, is mapped onto an the inert particle with uniform elastic moduli. This multi-scale and phase model is used to map the complex microstructure so the phases can be treated as having uniform properties [13].
Materials and Methods
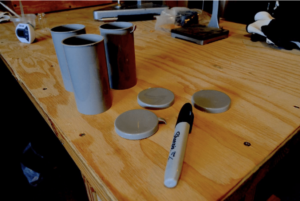
Setting up samples to run concurrently with VCCTL mixes.
Materials
A Type I/II Portland Cement (PC) with a Blaine fineness of 3790 cm2/g was used as the primary cementitious material. The composition of the OPC used in the experiments and VCCTL software is listed in Table 1. For the compression and calorimetry experiments the PC was mixed with potable tap water and a washed alluvial aggregate. The alluvial aggregate contained a grain size distribution of 8.2 mm to 11.2 mm. The absorption of the rounded rock was 1.1% and had a specific gravity of 2.64. Three water-to-cement (w-c) ratios were used throughout the experimentation. The proportions of constituents for the mixes are listed in Table 2.
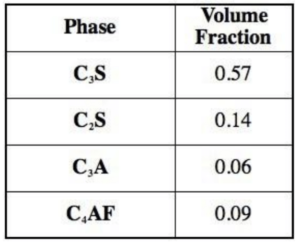
Table 1 — Phase Composition of Type I/II Ordinary Portland Cement
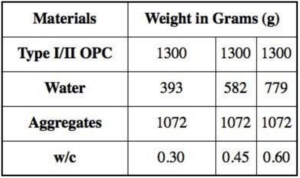
Table 2 — Mix Design Constituents for eVCCTL and Experiments
The composition and parameters presented in Table 1 and Table 3 were used in VCCTL to create anhydrous microstructures to simulate mixes listed in Table 1. Figure 1 is a result of the VCCTL’s rendering of the mix before the hydration process. From this primary rendering, VCCTL applies dissolution, dissipation and reaction cycle algorithms with conditions shown in Table 3. Iterations of this cycle are converted to real time by using experimentally obtained conversion factor of 3.5 * 10–4 hour/cycle2 [12]. Using the rules shown in Appendix A, VCCTL simulates whether each individual voxel will react and create hydrated products, remain unreactive, or return to its solidified form [13].
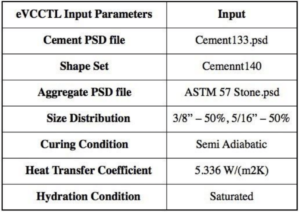
Table 3 — Input Parameters for eVCCTL Models
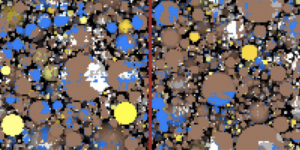
Figure 1 — Microstructure of cement matrix. The centerline represents an aggregate interface. Different shaded spheres represent the many compounds found in the cementitious mixture.
Methods
Compressive Strength: For mechanical strength simulation, VCCTL uses a simulated 3D microstructure at given point in hydration to apply finite element method analysis procedure to estimate its moduli of elasticity [9].
SACC: VCCTL uses information of heat of formation provided in Table 3 to find the heat of hydration [13].
CH Content: As for calcium hydroxide content (CH), VCCTL tallies amount of formed CH as product during the multiple iterations performed to simulate hydration. This provides VCCTL with how much and when CH is developed.
To perceive and verify the effect of water on cement hydration process on VCCTL, three different mixes, listed in Table 2, were batched. Each w/c ratio provides a different perimeter for VCCTL. Hence, three simulations were performed separately to observe the effect of water on cement hydration and effect on its properties. In the end, VCCTL provides the simulated mechanical strength, temperature and CH concentration values over period of time, which then could be compared with data obtained from physically batched concrete samples.
To verify the VCCTL results of the modeled mixes, a battery of three experiments were executed:
Compressive Strength: On the specimen break date, three 50.8 mm diameter by 101.6 mm cylindrical sample were crushed per ASTM C 39 [12]. Through the use of ACI 318, Young’s modulus was determined from the averaged compressive strengths and Equation 2 [14].

Equation 2 — Conversion of f’c to MOE by ACI 318 [14].
SACC: The semi-adiabatic calorimetric chamber (SACC) was used to measure the effect of the change in water on the heat evolution of the hydrated sample. The SACC was programmed to record the change in temperature for 24 hours with readings taken every 0.2 seconds. The temperature was reported in Celsius (C) to the 0.01 C with an accuracy of ± 0.21 C.
TGA: Thermal analysis of specimens was performed using a Netzsch STA 449 Jupiter F1 simultaneous thermal analyzer (thermogravimetric analysis in conjunction with differential scanning calorimetry). Scans were performed up to 1000C at a rate of 10C/min. Calcium hydroxide contents were calculated based on differential thermogravimetric analysis curved centered around 460C. Total mass loss between 105C and 1000C along with mass loss between 475C and 1000C were also quantified.
Case Study
 Simulated hydrated microstructure in VCCTL.
Results and Discussion
Young’s Modulus — Both the experiments and simulation exhibit a growth in strength of the composite. The Young’s Moduli of the tested samples were derived off of the maximum compressive strength using ACI 318 [14]. The Young’s moduli from the tested sample are greater than the simulated values for all three water to cementitious ratio, in Figure 2. While the discrepancies between the two values stay relatively minor, the trend displays that the discrepancies increase as the samples are left to cure longer. The increase of the Young’s Modulus found in the experimental mixes at later dates could be attributed to the degree and rate of actual cement hydration in the samples not present in the model. For the simulated Young’s Modulus, the progression of cement hydration and strength gain in the model decelerates after maximum degree of hydration is reached; strength growth development reduces.
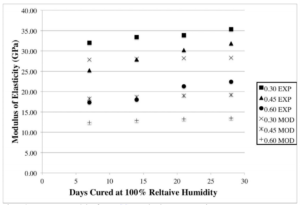
Figure 2 — Young’s Modulus from VCCTL and Laboratory Experiments
SACC — Figure 3 illustrates that temperature of the experimental calorimetry while Figure 4 shows the calorimetry from VCCTL. In Figure 3 the experimental data lacks the distinctive initial heat of hydration from mixing due to initial mixing is missing due to the time lapse between mixing and placement in the SACC. The missing stage can be seen in Figure 4 from VCCTL. The sample with the lowest water to cementitious ratio presents the highest temperature during its third hydration stage. This phenomenon was attributed to a reduction in the amount of water in the mixtures and thus replacement of water by cement particles, which would ultimately result in higher initial contact area between anhydrous particles, and water. The outcome is a faster rate of reaction during the sample’s early stages of hydration followed by dramatic increase in temperature. As the water is increased, the temperature over time is reduced, as demonstrated in Figure 3 and Figure 4.
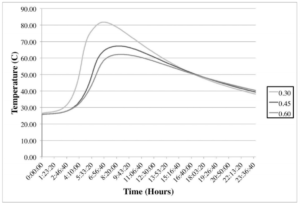
Figure 3 — Laboratory semi-adiabatic calorimetry. The distinctive heat rise due to the initial combination and mixing of cementitious constituents and water is missing.
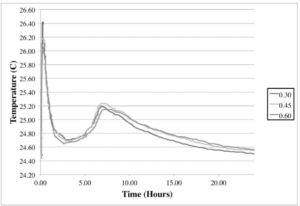
Figure 4 –VCCTL semi-adiabatic calorimetry. The distinctive heat rise due to the initial combination and mixing of cementitious constituents and water is missing.
The results from the experimental SACC in Figure 3 clearly demonstrates that a reduction of water to cementitious ratio to greater temperatures. There are some discrepancies with the results established from VCCTL in Figure 4 that do not agree with the results in Figure 3. As with the Young’s Modulus these discrepancies could be attributed to: (1) differences in the experimental cement and the cement composition input in the model, (2) the simulated samples are cured in saturated condition in VCCTL. This results in empty pores immediately being replaced with water during the simulation; which could reduce the simulated temperature gain in the lowest water to cementitious sample and (3) the temperature in the simulations were calculated in saturated environment.
CH Content — From the TGA it was found the amount of CH in the cured cement composite was reduced with reduction in water content for the experiments. Table 4 documents the change in CH loss for the samples. Based on the results, the lower water content promoted the conversion of CH thereby yielding lower percentages from the TGA. This reduction in CH can be attributed to a reduction in room necessary for the CH to grow. The data from VCCTL in Figure 5 demonstrates that the software calculated a lower percentage of CH for the higher water content mixture. The VCCTL does not take into account the room needed for CH grow. The voxels in the simulation convert to CH based on modeled constituents and growth algorithms. Therefore, higher water content affords the hydrated sample a reduction in the growth of CH.
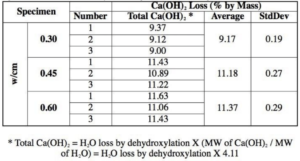
Table 4 — CH Loss found through Thermal Gravimetric Analysis

Figure 5 — VCCTL CH content over time.
Conclusions
Testing materials in the laboratory.
In the present work three water to cementitious ratios were introduced to the concrete composites for the determination of benefits ascertained in compressive strength, heat signatures, and hydrated products. The use of modeling and simulation was proposed as a viable option in when analyzing concrete mix design. Several conclusions can be drawn on the comparison and use of laboratory testing and VCCTL software for concrete mixture design and analysis:
- The similar trends in strength development over time between the experiments and model suggest that the model is a conservative tool for strength design and analysis.
- The accuracy of the saturated model is somewhat reduced for the temperature analysis but still develops similar trends.
- The disagreement in CH measurement is an anomaly, which will be the subject of further investigations.
- The relationships between the three testing methods verify, modeling and simulation as a conservative tool to design and analyze concrete mixtures. The use of model and simulation software cannot replace laboratory concrete mixtures and the associated experiments.
Written By: Jon Belkowitz, PhD, PE & Whitney Belkowitz
References
[1] Bentz, D. P. Influence of water-to-cement ratio on hydration kinetics: simple models based on spatial considerations. Cement and Concrete Research. 36. 238–244. 2006.
[2] Mindess, S. Concrete. Wiley and Sons, Inc. 2nd Edition. 2003.
[3] Neville, A.M. Properties of Concrete. 2nd Edition. 2000.
[4] J. Thomas, Biernacki, J., Bullard, J., Bshnoki, S., Dolado, J., Schere, G., Luttge, A. Modeling and Simulation of Cement Hydration Kinetics and Microstructure Development. Cement and Concrete Research. 2011.
[5] D.P. Bentz, National Institute of Standards and Technology Interagency Report, Technology Administration. U.S. Department of Commerce. NISTIR 7232. June. 2005.
[6] Sun, Z., Garboczi, E. and Shah, S. Modeling the elastic properties of concrete composites: Experiment, differential effective medium theory, and numerical simulation. Cem Concr Comp. 29, 22–38. 2007.
[7] D.P. Bentz, National Institute of Standards and Technology Interagency Report, Technology Administration. U.S. Department of Commerce. NISTIR 7232. 2005.
[8] D.P. Bentz and E.J. Garboczi. Percolation of phases in a 3D
cement paste microstructure model. Cem Concr Comp. 21. Pp. 325–344. 1991.
[9] C.−J. Haecker, E.J. Garboczi, J.W. Bullard, R.B. Bohn, Z. Sun, S.P. Shah and T. Voigt. Modeling the linear elastic properties of portland cement paste. Cem Concr Comp. 35, 1948–1960 (2005).
[10] Sun, Z., Garboczi, E. and Shah, S. Modeling the elastic properties of concrete composites: Experiment, differential effective medium theory, and numerical simulation. Cem Concr Comp. 29, 22–38 (2007).
[11] D.P. Bentz, National Institute of Standards and Technology Interagency Report, Technology Administration. U.S. Department of Commerce. NISTIR 7232. June. (2005).
[12] CEMHYD3D: A 3D Cement Hydration and Microstructure Development Modeling Package. Version 3.0. NISTIR 7232. June (2005)
[13] D.P. Bentz. 3D Computer Simulation of Portland Cement Hydration and Microstructure Development , Journal of the American Ceramic Society, 80 (1), pp. 3–21, 1997.
[14] ACI 318–11. Building Requirements for Structural Concrete and Commentary. American Concrete Institute. 2011. Pp. 111–112.